
Our Data Coverage
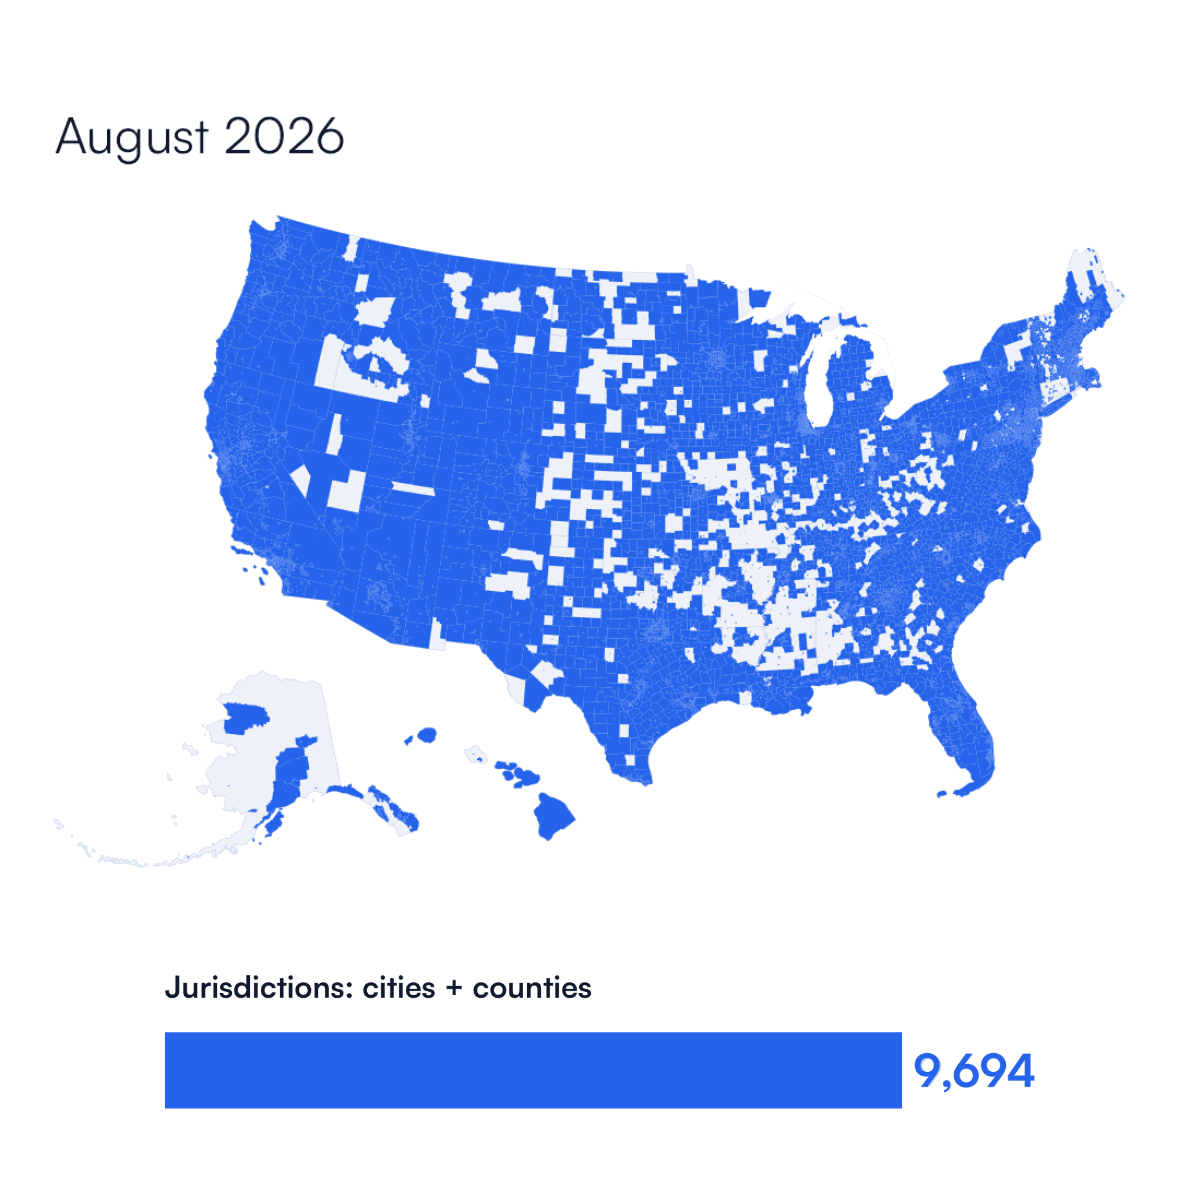
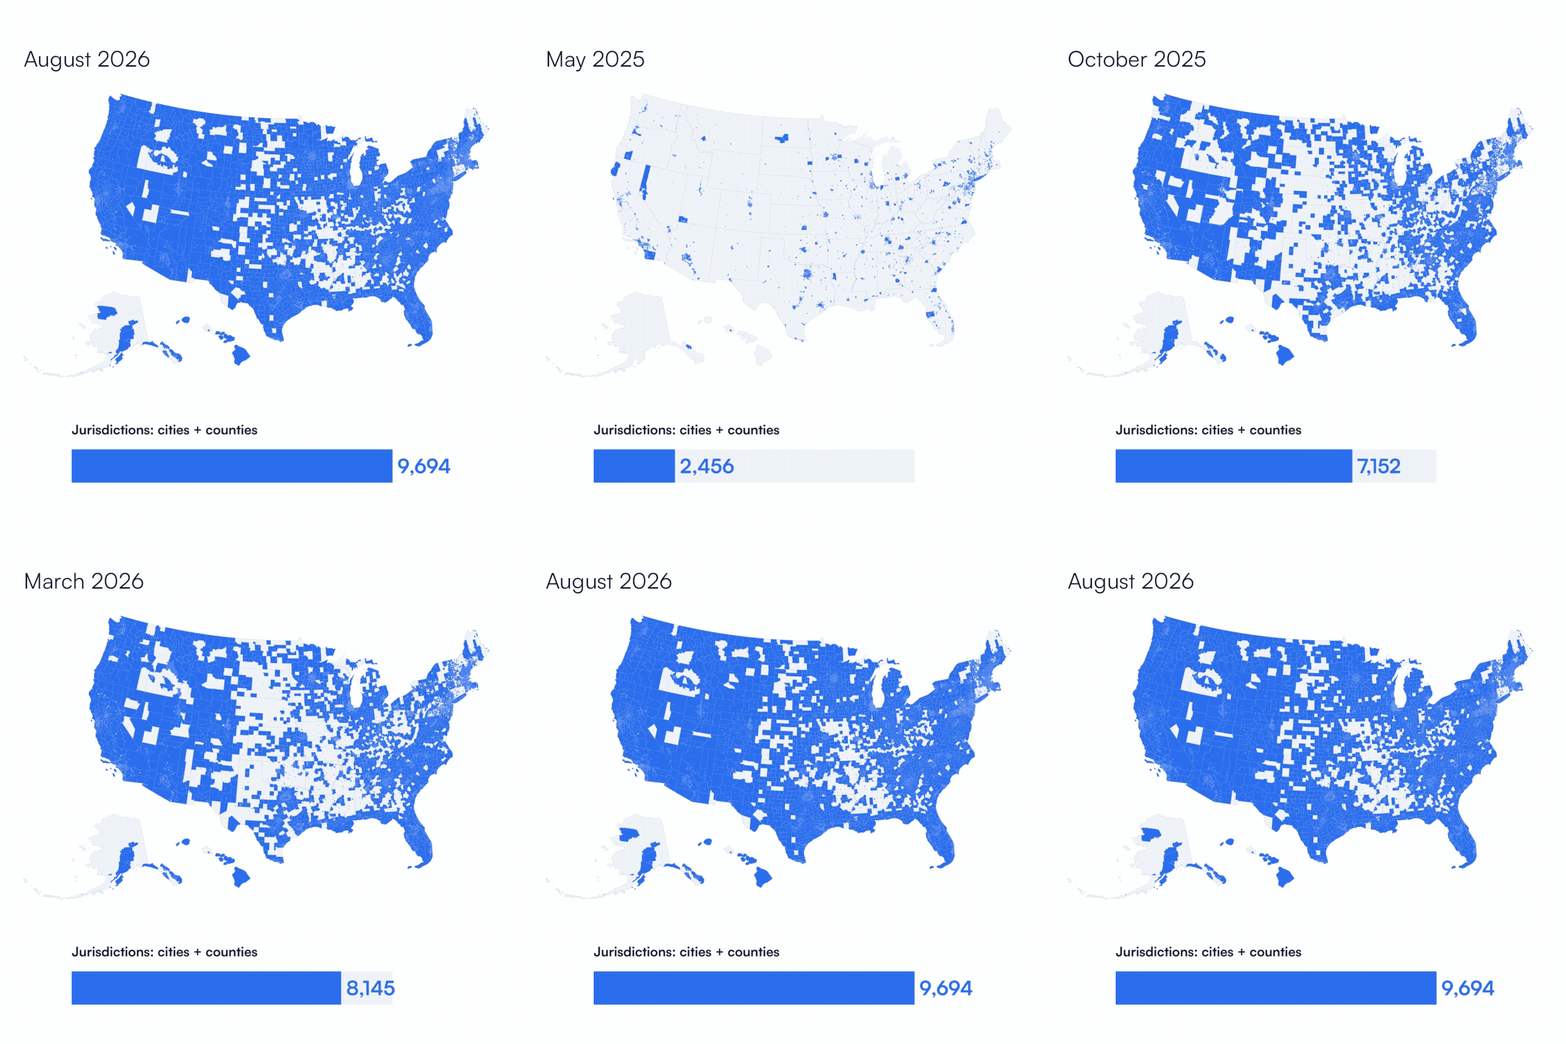
Coverage over local governments where 94% of Americans live. Built entirely on public data, refreshed daily. The new gold standard for understanding local government.
9300+
Jurisdictions
92K
Meeting hours monthly
25+
Municipal boards
735K+
Agendas and Minutes
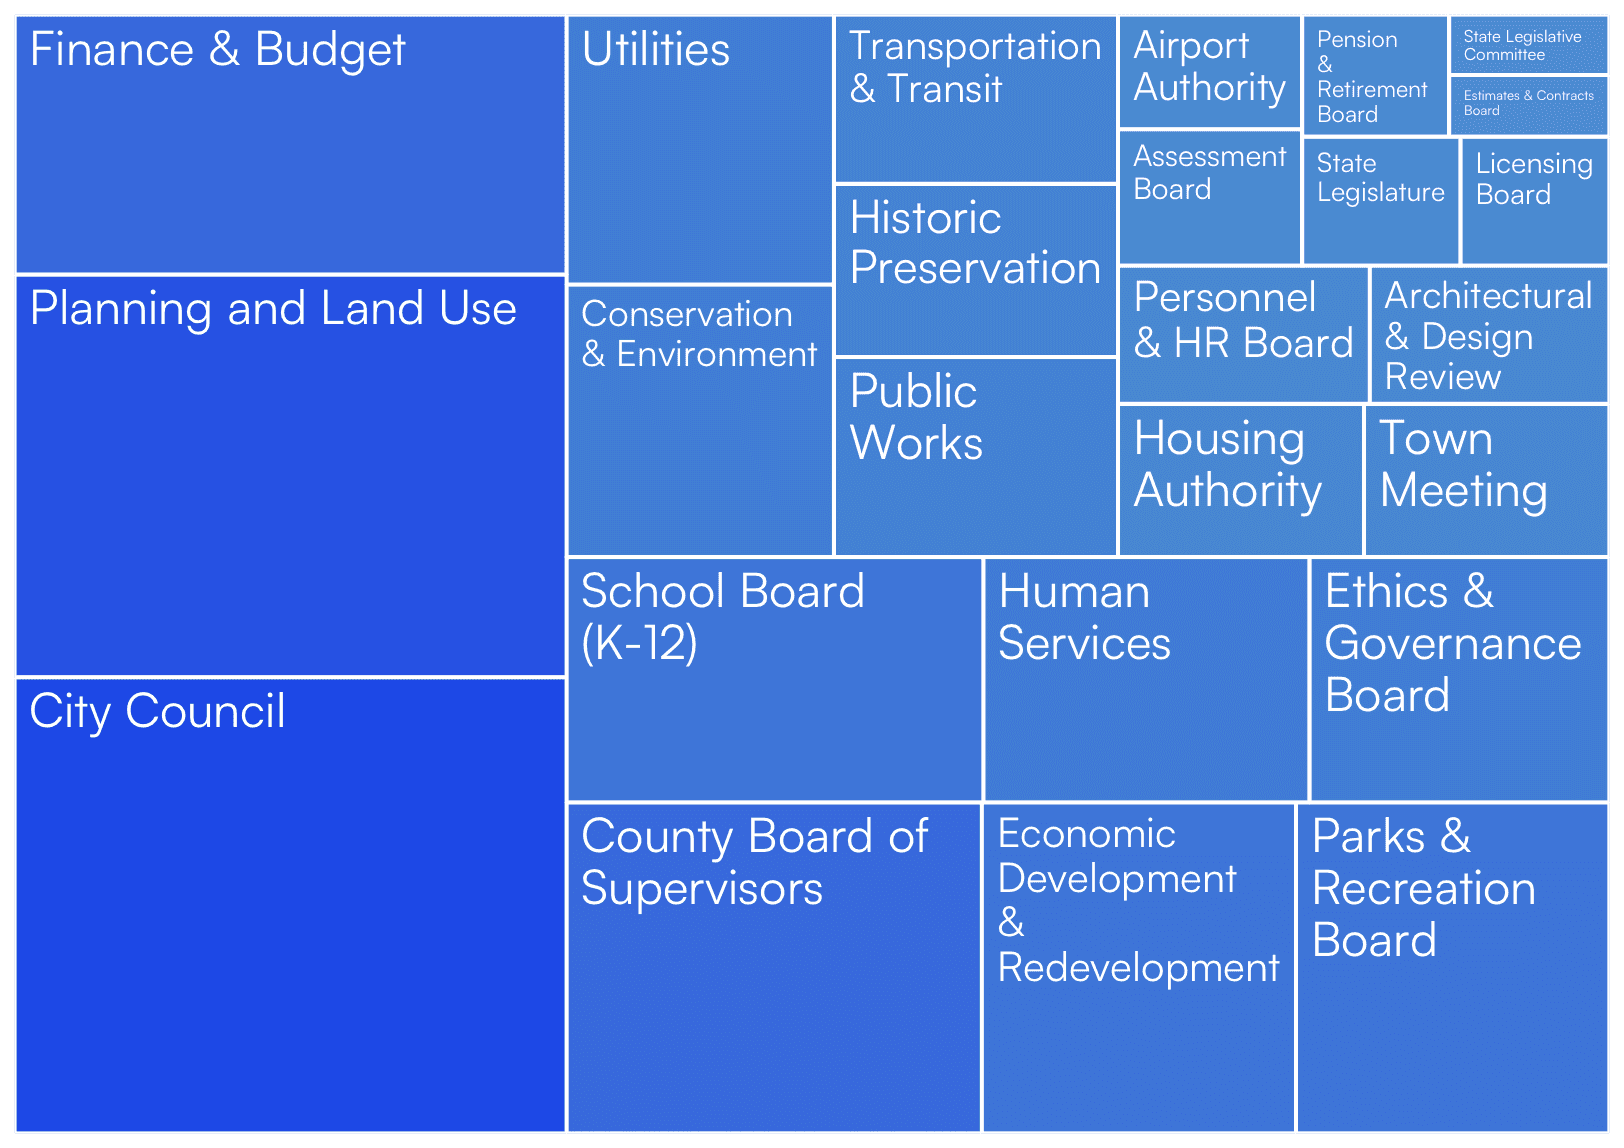
Coverage Across Various Governing Bodies
Millions of hours of data from 25+ municipal boards that impact real estate development
Our Technology : Ontology & Knowledge Graphs
Connecting local government data into a searchable picture of what’s happening.
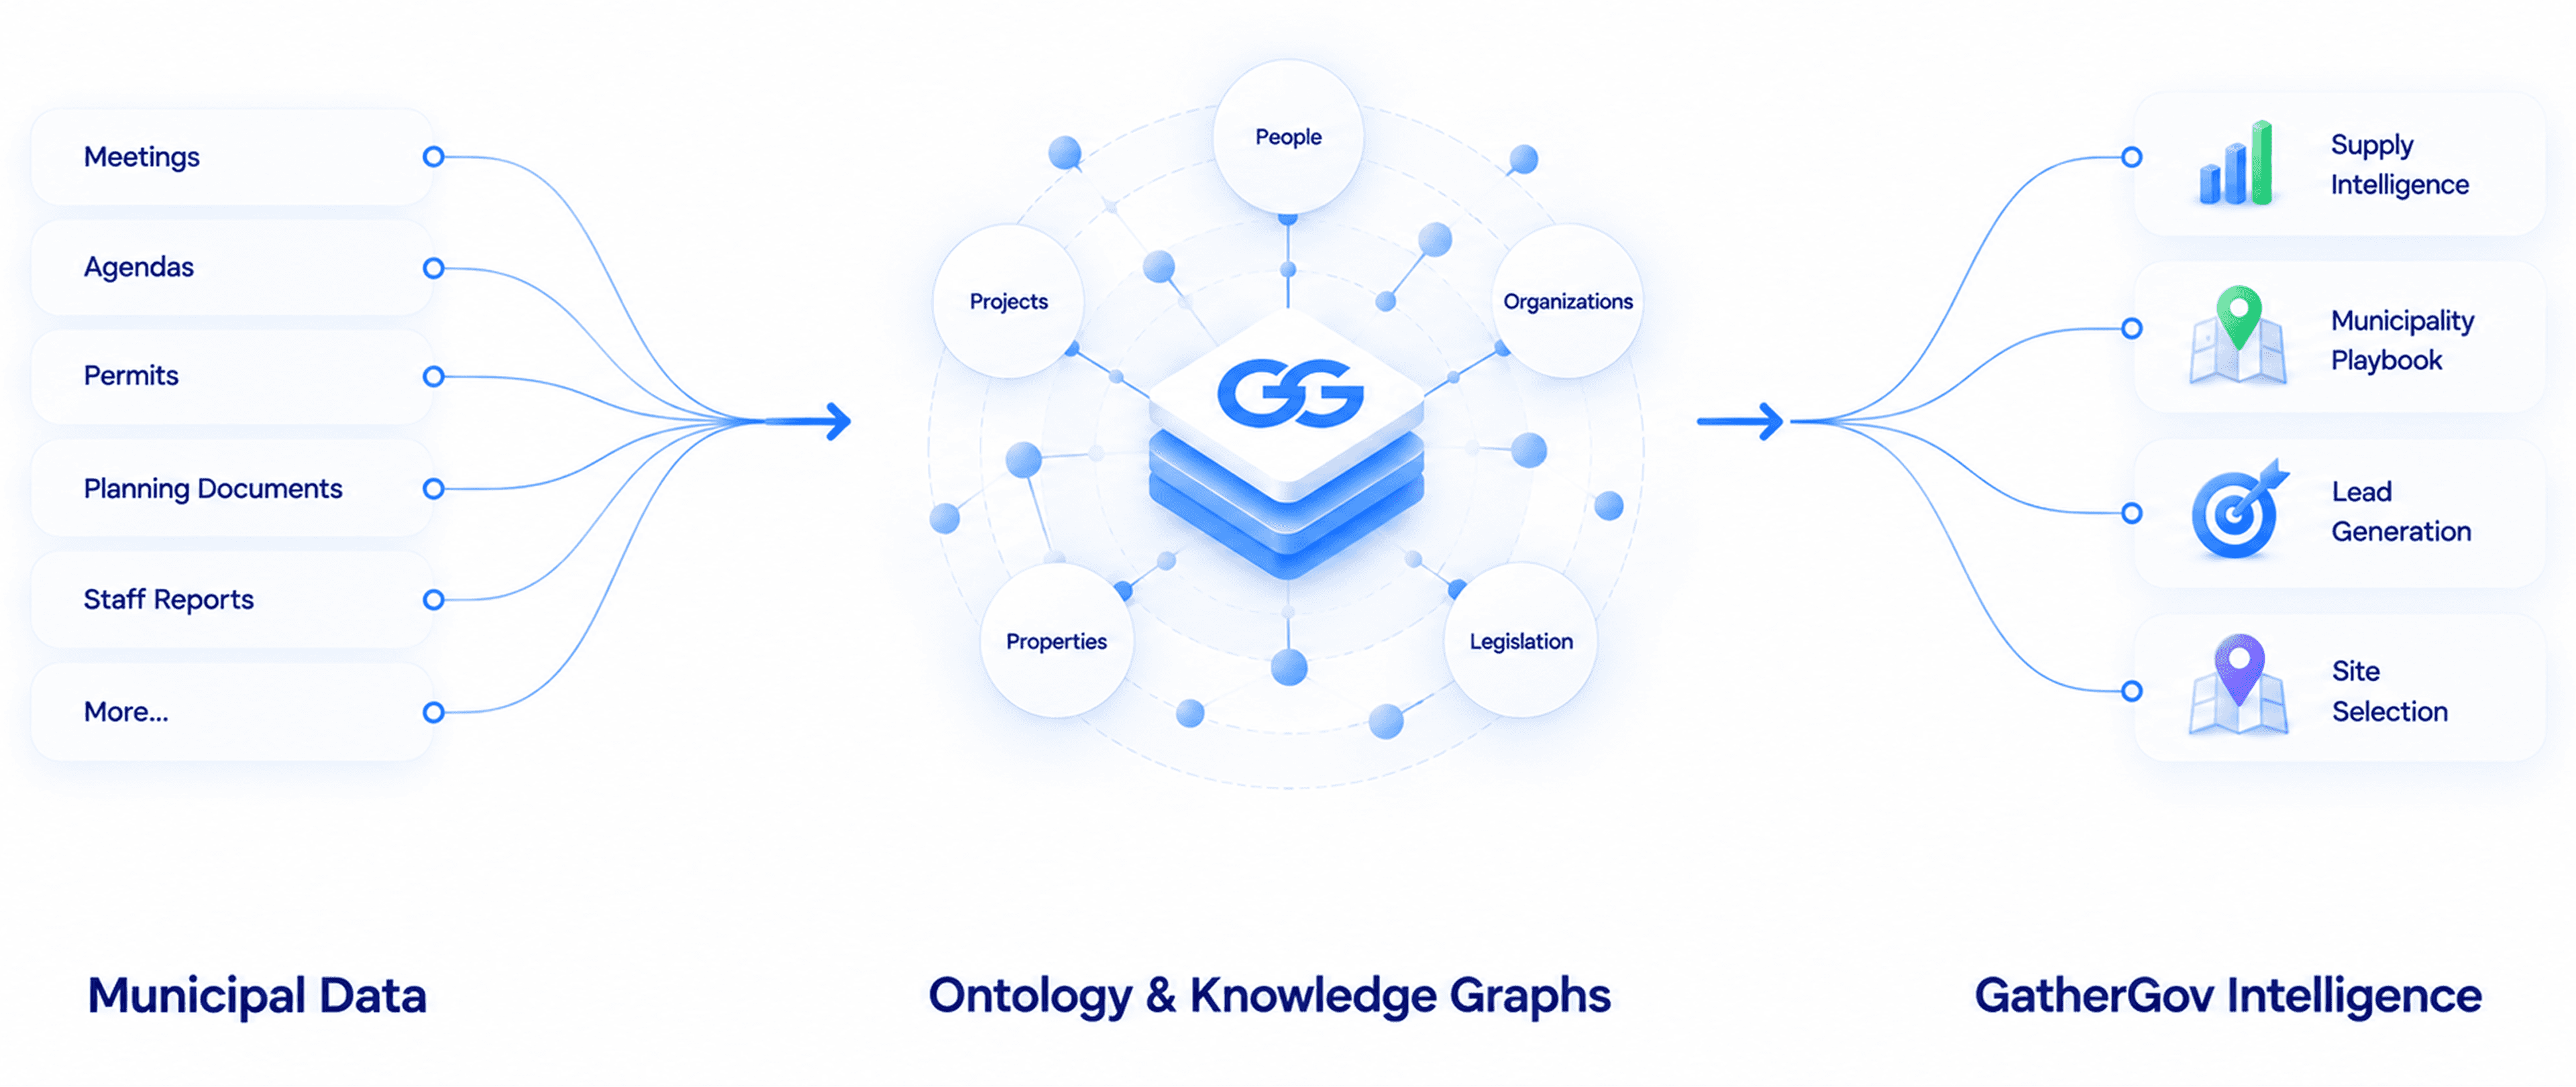
We’re building the most comprehensive knowledge graph of local government data for real estate owners and AEC.
The information owners, developers, and investors need is scattered across meetings, agendas, minutes, staff reports, permits, planning documents, and more with few obvious connections between them. A project mentioned today may be the same one that appeared in a permit six months ago and was discussed across multiple meetings. Finding those connections manually is difficult, but often where the most valuable insights are.
We use entity resolution and ontology to recognize when different records refer to the same person, company, project, property, or legislation, and connect them into a knowledge graph.
The result is a connected, searchable history of what’s happening locally. Instead of digging through individual documents, research teams can follow a project, company, property, or piece of legislation over time, seeing who is involved, what decisions have been made, what approvals have happened, and what comes next. This turns thousands of disconnected public records into a clear picture of what matters and where things are headed.
Frequently Asked Questions
How is this data gathered?
We aggregate data from public sources, including local government websites, meeting portals, agendas, minutes, staff reports, permits, and planning records. We standardize and connect this information so it can be searched and analyzed as one unified dataset.
How often is it updated?
24/7. We continuously monitor our sources and update the data as new records become available. This means you can track local activity as it develops, rather than relying on static or outdated datasets.
What is a knowledge graph?
A knowledge graph connects people, companies, projects, properties, legislation, and events across different sources to show how they relate to one another. It turns thousands of disconnected records into a connected history, making it easier to understand what happened, who was involved, and what may happen next.

#GatherGov Readout